You’ve just concluded your hearing test. The hearing specialist is now coming into the room and presents you with a graph, like the one above, except that it has all of these characters, colors, and lines. This is intended to explain to you the exact, mathematically precise features of your hearing loss, but to you it may as well be written in Greek.
The audiogram adds confusion and complexity at a time when you’re supposed to be concentrating on how to strengthen your hearing. But don’t let it deceive you — just because the audiogram looks complicated doesn’t mean that it’s hard to comprehend.
After reading through this article, and with a little vocabulary and a handful of basic principles, you’ll be reading audiograms like a seasoned professional, so that you can concentrate on what actually counts: better hearing.
Some advice: as you read the article, reference the above blank audiogram. This will make it much easier to understand, and we’ll address all of those cryptic marks the hearing specialist adds later.
Understanding Sound Frequencies and Decibels
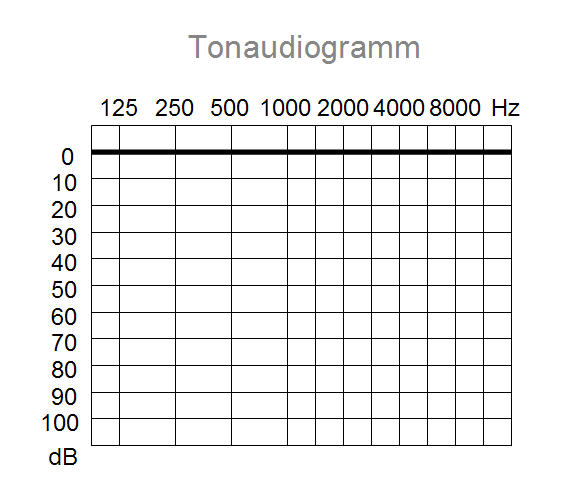
The audiogram is really just a diagram that records sound volume on the vertical axis and sound frequency on the horizontal axis. (are you having flashbacks to high school geometry class yet?) Yes, there’s more to it, but at a basic level it’s just a chart graphing two variables, as follows:
The vertical axis documents sound intensity or volume, measured in decibels (dB). As you move up the axis, the sound volume decreases. So the top line, at 0 decibels, is a very soft, faint sound. As you move down the line, the decibel levels increase, representing steadily louder sounds until you get to 100 dB.
The horizontal axis records sound frequency, measured in Hertz (Hz). Starting at the top left of the graph, you will see a low frequency of 125 or 250 Hz. As you proceed along the horizontal axis to the right, the frequency will gradually increase until it arrives at 8,000 Hz. Vowel sounds of speech are normally low frequency sounds, while consonant sounds of speech are high frequency sounds.
So, if you were to begin at the top left corner of the graph and draw a diagonal line to the bottom right corner, you would be increasing the frequency of sound (shifting from vowel sounds to consonant sounds) while raising the intensity of sound (moving from fainter to louder volume).
Testing Hearing and Marking Up the Audiogram
So, what’s with all the markings you normally see on this basic chart?
Simple. Start at the top left corner of the graph, at the lowest frequency (125 Hz). Your hearing professional will present you with a sound at this frequency by means of earphones, beginning with the smallest volume decibel level. If you can hear it at the lowest level (0 decibels), a mark is created at the intersection point of 125 Hz and 0 decibels. If you are not able to perceive the 125 Hz sound at 0 decibels, the sound will be provided once more at the next loudest decibel level (10 decibels). If you can perceive it at 10 decibels, a mark is created. If not, proceed on to 15 decibels, and so on.
This same routine is carried out for each frequency as the hearing specialist travels along the horizontal frequency axis. A mark is produced at the lowest perceivable decibel level you can perceive for every different sound frequency.
As for the other symbols? If you observe two lines, one is for the left ear (the blue line) and one is for the right ear (the red line: red is for right). An X is generally used to mark the points for the left ear; an O is employed for the right ear. You may discover some additional symbols, but these are less vital for your basic understanding.
What Normal Hearing Looks Like
So what is thought to be normal hearing, and what would that look like on the audiogram?
Individuals with standard hearing should be able to perceive every sound frequency level (125 to 8000 Hz) at 0-25 decibels. What might this look like on the audiogram?
Take the empty graph, locate 25 decibels on the vertical axis, and sketch a horizontal line entirely across. Any mark made beneath this line may signify hearing loss. If you can perceive all frequencies underneath this line (25 decibels or higher), then you likely have normal hearing.
If, on the other hand, you cannot perceive the sound of a specific frequency at 0-25 dB, you likely have some type of hearing loss. The smallest decibel level at which you can perceive sound at that frequency determines the stage of your hearing loss.
For example, consider the 1,000 Hertz frequency. If you can hear this frequency at 0-25 decibels, you have normal hearing for this frequency. If the smallest decibel level at which you can perceive this frequency is 40 decibels, for example, then you have moderate hearing loss at this frequency.
As an overview, here are the decibel levels correlated with normal hearing along with the levels correlated with mild, moderate, severe, and profound hearing loss:
Normal hearing: 0-25 dB
Mild hearing loss: 20-40 dB
Moderate hearing loss: 40-70 dB
Severe hearing loss: 70-90 dB
Profound hearing loss: 90+ dB
What Hearing Loss Looks Like
So what might an audiogram with signs of hearing loss look like? Considering that many instances of hearing loss are in the higher frequencies (labeled as — you guessed it — high-frequency hearing loss), the audiogram would have a descending slanting line from the top left corner of the graph slanting downward horizontally to the right.
This indicates that at the higher-frequencies, it requires a progressively louder decibel level for you to perceive the sound. And, seeing as higher-frequency sounds are associated with the consonant sounds of speech, high-frequency hearing loss impairs your ability to understand and pay attention to conversations.
There are a few other, less frequent patterns of hearing loss that can turn up on the audiogram, but that’s probably too much detail for this article.
Testing Your New-Found Knowledge
You now know the fundamentals of how to interpret an audiogram. So go ahead, book that hearing test and surprise your hearing specialist with your newfound talents. And just imagine the look on their face when you tell them all about your high frequency hearing loss before they even say a word.